Bing Chat AI for those Gnarly Excel Formulas

I do a lot of data migrations, moving data from one system to another. Usually as part of a migration from a legacy system to Dynamics 365 CRM. Oftentimes I’m confronted with gnarly data in Excel spreadsheets that lack consistent formatting. Say you have different users entering Doctor’s names into a database, and they only have a free form text field. The users were instructed to put the doctors’ credentials after their name. They will likely enter it in any of the following formats: Gregory House, MD Merideth Grey MD Hannibal Lecter, D.O. Temperance Brennan, FA, OD Emmet Brown, Ph. D. Trying to parse this data down is easy if you’re super-skilled Excel expert. Myself, I don’t do this every day so I have to go look up these formulas. Well, I have to share how easy this is now. See below for my back-and-forth with Bing AI Chat to get the place with my data can be easily cleaned-up. I need an Excel function that strips off the end part of a text field. It is formatted like “lastname, MD” and I want to remove the “, MD” part. Sure, you can use the `SUBSTITUTE` function in Excel to achieve this. Here’s an example: “`excel =SUBSTITUTE(A1, “, MD”, “”) “` In this formula, `A1` is the cell that contains the text you want to modify. This formula will replace all occurrences of “, MD” in the text with an empty string, effectively removing it. If the “, MD” text is not found in the cell, the original text will be returned unchanged. Please replace `A1` with the actual cell reference in your worksheet. Remember to drag the fill handle (the small square at the bottom-right of the cell) down to apply this formula to the entire column if needed. Let me know if you need further assistance! That almost worked except there are more variations than just “, MD” — need to adjust formula to remove anything at the end of the string starting with the comma. If you want to remove anything after the comma, including the comma, you can use the `LEFT` and `FIND` functions in Excel. Here’s an example: “`excel =LEFT(A1, FIND(“,”, A1) – 1) “` In this formula, `A1` is the cell that contains the text you want to modify. The `FIND` function locates the position of the comma in the text, and the `LEFT` function extracts the text to the left of that position. If the comma is not found in the cell, the formula will return an error. To handle cells without a comma, you can use the `IFERROR` function: “`excel =IFERROR(LEFT(A1, FIND(“,”, A1) – 1), A1) “` This formula will return the original text if no comma is found. Please replace `A1` with the actual cell reference in your worksheet. Remember to drag the fill handle (the small square at the bottom-right of the cell) down to apply this formula to the entire column if needed. Let me know if you need further assistance! That worked great! But there are some records where they omitted the comma and just used a space. Can we remove any text after the initial string of continuous text that starts (or is separated by) a comma or a space? Sure, you can use a combination of Excel functions to achieve this. Here’s an example: “`excel =IFERROR(LEFT(A1, MIN(FIND({“,”, ” “}, A1&”, “&” “)) – 1), A1) “` In this formula, `A1` is the cell that contains the text you want to modify. The `FIND` function is used with an array of characters (comma and space) to locate the position of the first occurrence of either character in the text. The `MIN` function is used to find the smallest position number, which corresponds to the first separator in the text. The `LEFT` function then extracts the text to the left of that position. If neither a comma nor a space is found in the cell, the `FIND` function will return an error. The `IFERROR` function is used to handle this by returning the original text. Please replace `A1` with the actual cell reference in your worksheet. Remember to drag the fill handle (the small square at the bottom-right of the cell) down to apply this formula to the entire column if needed. Let me know if you need further assistance!
Integration of Maps with Dynamics 365 CRM & Power Apps for Enhanced Business Goals
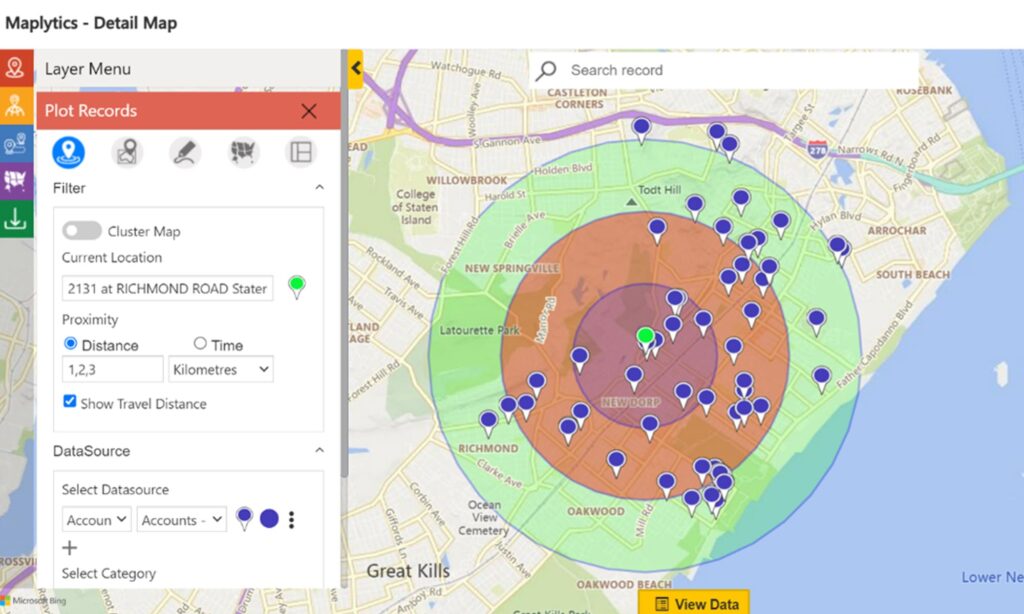
Maplytics is the de facto leader in Dynamics 365 mapping integration. By geocoding CRM records, the affordable mapping add-in provides radius search, territory management, auto-scheduling, and route optimization.
Useful SSIS Expressions
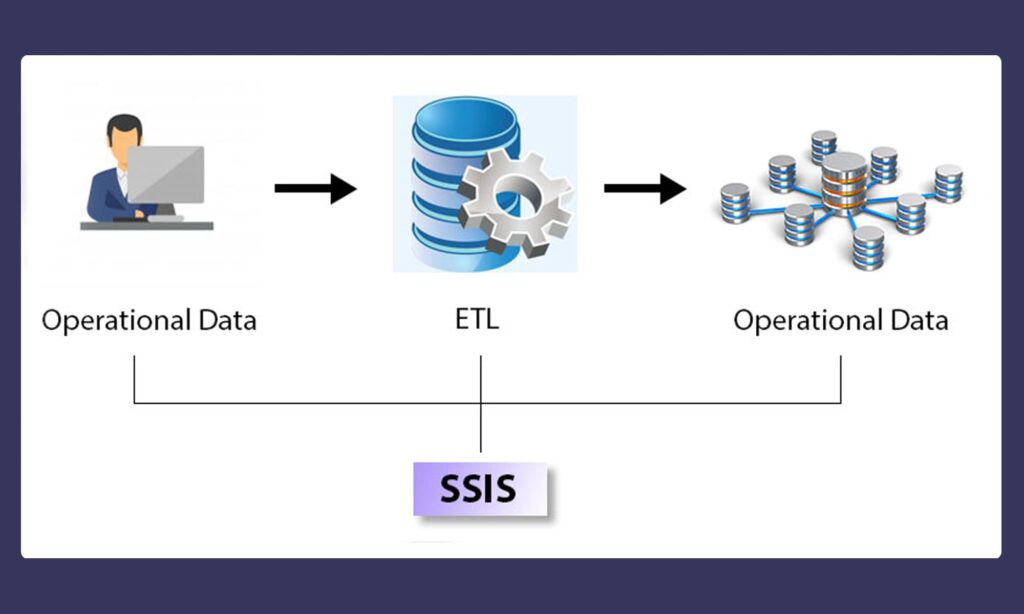
Change Root Business Unit Name in Dynamics 365 CRM It is possible to change the root Business Unit Name in Dynamics 365 CRM using SSIS. We will get the GUID of Business Unit using Advanced Find and Export to Excel. You’ll need to cast the GUID to a unique identifier in SSIS, with a formula as indicated in the article below, or like this: (DT_GUID) (“{” +”6ddb52ca-f0df-e711-a95b-000d3a370f0a” + “}”) Next, we use an SSIS job with one record input including the GUID of the root Business Unit, and a derived column for the “new” name for the Business Unit. The SSIS job will look like this — see following screenshots. Convert (Cast) GUID Text String to GUID formatted for import into D365 Convert a GUID text string to a GUID formatted for import to Dynamics 365. You can extract the GUID from a list of users, exported to Excel. Use the “Derived Column” SSIS component to cast into GUID format. (DT_GUID) (“{“+[Owner]+”}”) where [Owner] is the GUID in text format. T-SQL Case Statement for Status Codes Dynamics 365 Status Codes are easy once you get used to them. You have to make sure they are aligned such that only the “Open” status reasons (statuscode) are associated with the “Open” status code (statecode), and only the “Completed” status reasons are associated with the “Completed” status code. Use a simple case statement to get your data ready for upload to Dynamics 365 CRM through the KingswaySoft D365 Destination component. ,CASE [Activity Status] WHEN ‘Open’ THEN 0 WHEN ‘Completed’ THEN 1 WHEN ‘Canceled’ THEN 2 WHEN ‘Scheduled’ THEN 3 ELSE ‘999’END AS phl_statecode,CASE [Status Reason] WHEN ‘Completed’ THEN 5 WHEN ‘Not Started’ THEN 2 WHEN ‘In Progress’ THEN 3 WHEN ‘Waiting on someone else’ THEN 4 WHEN ‘Deferred’ THEN 7 ELSE ‘999’END AS phl_statuscode Note, this works in both Dyanamics 365 (on-premises) and Dynamics 365 online — this example is for online.
Dynamics 365 Team Members License Use Rights
Team Member licenses are “cross-application” licenses (meaning users can access both sales and customer service, for example). The Team Member licenses are $8 / user per month. From the Dynamics 365 licensing guide (March 2021) (page 5): Team Members: named user subscription designed for users who are not tied to a particular function, but who require basic Dynamics 365 functionality. This license entitles the user to light weight access through designated scenarios built into Team Members experience. Full access to applications is governed through Dynamics 365 application user. The Team Members user SL enables users to read Dynamics 365 data generated from, say, the Sales or Customer Service applications. The Team Members user SL grants a user access to participate in a limited specific set of functionalities, as defined below, from the applications. The Team Members license does not provide access to custom applications and is not intended for scenarios beyond those listed in the applicable use rights sections. Reference Appendix B for more information on custom entities. Here’s a high-level description of the Team Member user subscription license from page 35 of the licensing guide: The Team Members user subscription license grants a user the following Sales, Customer Service, or Field Service rights for their own use and not for, or on behalf of, other individuals. Create, read, update, and delete contacts, activities, and notes. Update personal employee information. Record time and expense for Project Operations, and apply for projects. User reporting and dashboards. Participate as an end-customer of Dynamics 365 services such as responding to surveys. Team Members application module may be customized with a maximum of fifteen additional entities. This is the use rights chart for sales – there’s also one for the Customer Service application. This is a more granular chart showing Team Member subscriber license use rights. I removed the none applicable areas like Finance, Supply Chain Management, and Commerce.
Get to Know Sales Automation for CRM Online
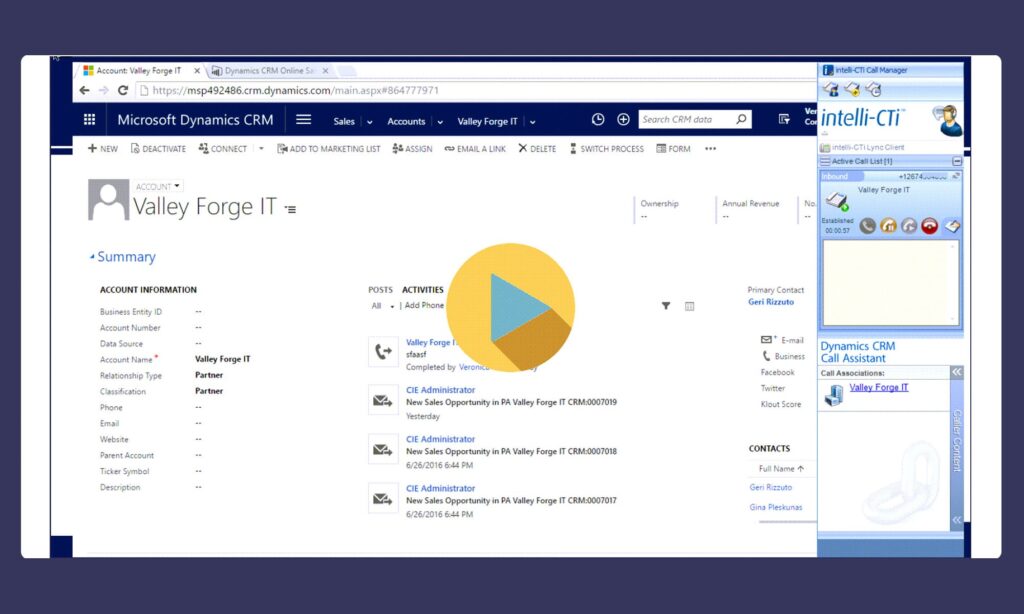
Get to Know Sales Automation for Microsoft Dynamics CRM Online covers topics such as Adxstudio Portal, QGate intelli-CTi, Skype-for-Business PSTN Calling, Office 365 Groups, and Business Process Flows.
How to Quickly Set Up and Send Bulk Text Messages in Dynamics 365
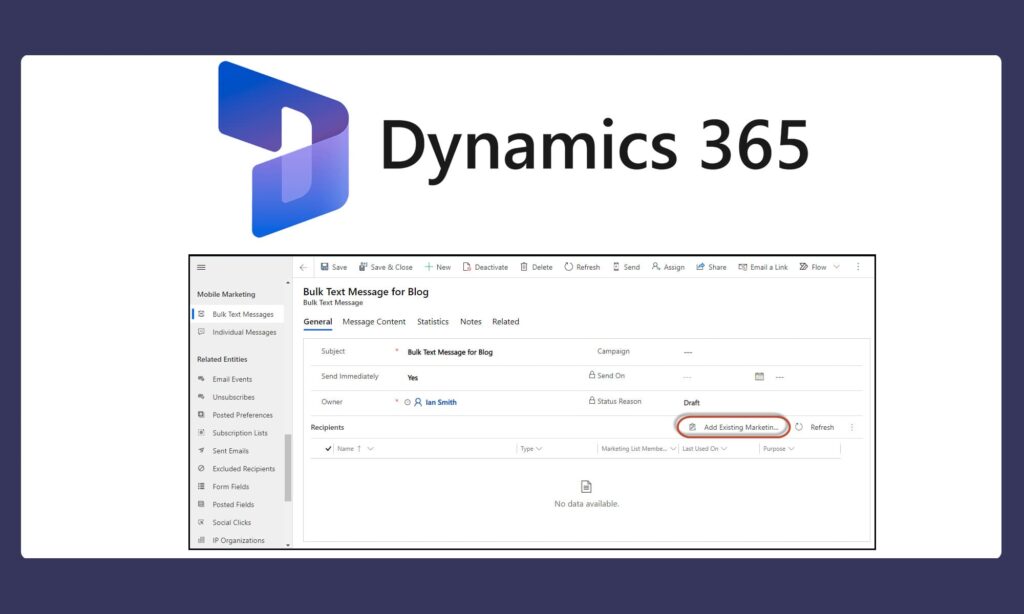
How to Quickly Set Up and Send Bulk Text Messages in Dynamics 365 Getting Ready to Send Text Messages Do You Have Mobile Phone Numbers for Your Target Audience? Earlier this year, our client, a cyber charter school, had expressed some interest in sending bulk text messages to their prospective Parent/Guardians. Fortunately, this particular client was already using ClickDimensions for email blasts, integrated web forms and campaign automations. SMS with ClickDimensions allows you to send marketing text messages to your Leads, Contacts, and/or Accounts, individually or in bulk. To inform prospective Parent/Guardians about scheduled virtual Open Houses to promote their cyber charter school, our client wanted to target Contacts. For the purpose of this blog, I will be focusing on sending text messages to Contacts. To prepare for this initiative, we added some customizations to the Dynamics 365 Contact form and the ClickDimensions web form that captures the Parent/Guardian data. The Dynamics Parent/Guardian form provides the ability to update two different Phone Number fields. Either Phone Number can be identified as belonging to a mobile phone. The ClickDimensions web form contains one Phone Number field with a corresponding checkbox to indicate that it’s a mobile phone. On both forms, if the indicator is set, a workflow copies the Phone Number value to the out of the box Mobile Phone field. As a result of this configuration change, there are now almost 2,000 Parent/Guardian records with Mobile Phone numbers ready to receive our client’s text messages! Choose a Service Provider After you have collected the Mobile Phone data for your target audience, the rest is quite easy. If you are familiar with ClickDimensions Email Sends, the Bulk Text Message is configured in a very similar way. But, first you need to set up an account with a service provider. ClickDimensions provides options to use several different service providers. Our client chose Twilio. You would need to go to the Twilio website for details on the Twilio features and account setup requirements. However, be assured that the SMS settings of your new Twilio account can be easily configured to begin sending text messages. There are multiple payment plans available and all charges are paid directly to Twilio. After your account is set with a service provider like Twilio, the next thing you need to do is add a Connector to ClickDimensions. The Connector is configured to specify which fields in your Lead, Contact, and Account records contain the phone number you want to send the text messages to. As mentioned above, for our client, we chose the out of the box Mobile Phone field on the Contact entity. Recommended Configuration Changes in Dynamics There are no required configuration changes in Dynamics. However, there are two simple modifications that I would recommend: Add the out of the box Allow Text Messages field to the section where you display the contact method preferences on the Contact form – this will allow you to see if a Contact unsubscribed. Configure the Timeline to show the Text Message activity type – this way you will see outgoing text messages and any replies to those text messages – we created a custom Text Message card form that displays the Text Message Subject field and/or Text Message Message field. How to Send Bulk Text Messages in ClickDimensions As I mentioned before, sending a Bulk Text Message in ClickDimensions is very similar to an Email Send. You need to determine your target audience, craft an appropriate message, and test it. Then you are ready to send your text messages regarding promotions, special offers, or events even when your audience is not logged into their email. Create a Marketing List After you decide who (Leads, Contacts or Accounts) you want to target in this bulk text message, you’ll need to create one or more Marketing Lists. I recommend a dynamic Marketing List that filters on recipients that are active and have a Mobile Phone field that contains data. You may have additional filters required to satisfy the specific goal of your marketing campaign. Create a Bulk Text Message Record In ClickDimensions, creating a Bulk Text Message record is very simple. On the General tab, add a meaningful Subject line, update some of the other fields if you’d like, and click on Save. This will create the Bulk Text Message record to then subsequently allow you to select one or more existing Marketing Lists to identify your target audience. Then go to the Message Content tab to type in your message. You can add personalization by mapping in fields from the entity type that you are targeting. You can also include fields from the related entity record Owner. Our client included a link to their website where the visitor can register for one of their virtual Open Houses. The system will display how many characters you’ve used in the bottom right corner. The recommendation is to use 160 characters or less, but there is no limit. Be sure to click on Save within the message window before hitting the Send button up in the command bar. Of course, as with an Email Send, it is always a good idea to first test it out with a group of co-workers as the recipients. Reviewing the Results of Your Bulk Text Message Unsubscribes As with emails, recipients of text messages should be given the opportunity to unsubscribe from receiving future messages from your organization. You will notice in my sample message above, I included a clause with instructions to reply STOP to unsubscribe. STOP is one of multiple replies available to signal to Twilio and ClickDimensions that the recipient does not want to receive any more text messages. This is effective in both the Opt-In and Opt-Out subscription management methods. When a recipient replies to a text message with STOP, this updates the Allow Text Messages field to “No”. If your CRM environment is on the Opt-In method as our client is, ClickDimensions will also create an Unsubscribe record for the recipient’s phone number. The ClickDimensions app provides an out of the box view of Unsubscribe records for your review
Dynamics 365 Customer Service Power Moves — 2020 Wave 1
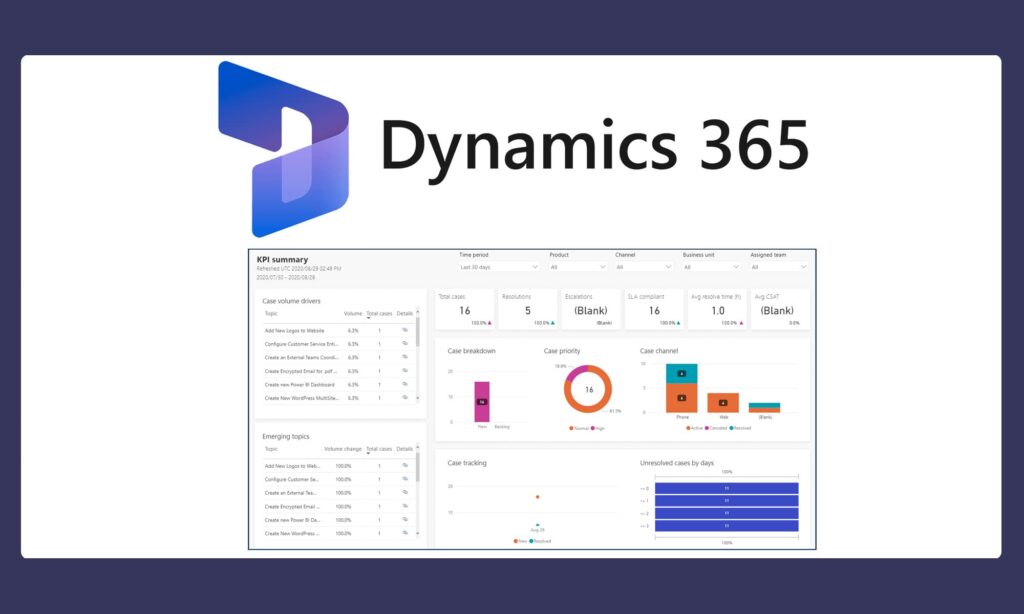
Interactive Dashboards A big part of the Unified Interface, Interactive Dashboards provide a quick way to get an overview of your customer service system. The Customer Service Hub comes with two out-of-the-box Interactive Dashboards, which you can see on the video. Apps as an Overlay The Customer Service Hub app is one of many apps in your Dynamics 365 system. The concept of an app lends itself to simplifying end-user navigation and security. The Apps can be filtered to just show the entities that are related to a particular subject area, like customer service. The App Designer controls which entities and associated forms, views, and dashboards are included in each app, as well as providing for the Site Map Designer for setting up the navigation. Business Process Flow Designer The Business Process Flow Designer allows your users to customize the flow of your business processes to match best practices. Set the design process to gather all the information you need, and make sure it is gathered consistently before enabling users to proceed the next stage of the process or closing out a case. Enhanced Email Experience Use the new enhanced email experience to send emails quickly and efficiently from within the Timeline in the CRM case records. The enhanced email experience, new in Dynamics 365 2020 Release Wave 1, has rich text formatting and allows you to use email templates for quickly creating standardized responses. Entitlements You can enable entitlements to kick-in for each customer when a new case is created. You can create entitlements for each customer based on a template.
How Your Sales Team Benefits from a Dynamics 365 Sales Forecast (Part 2)
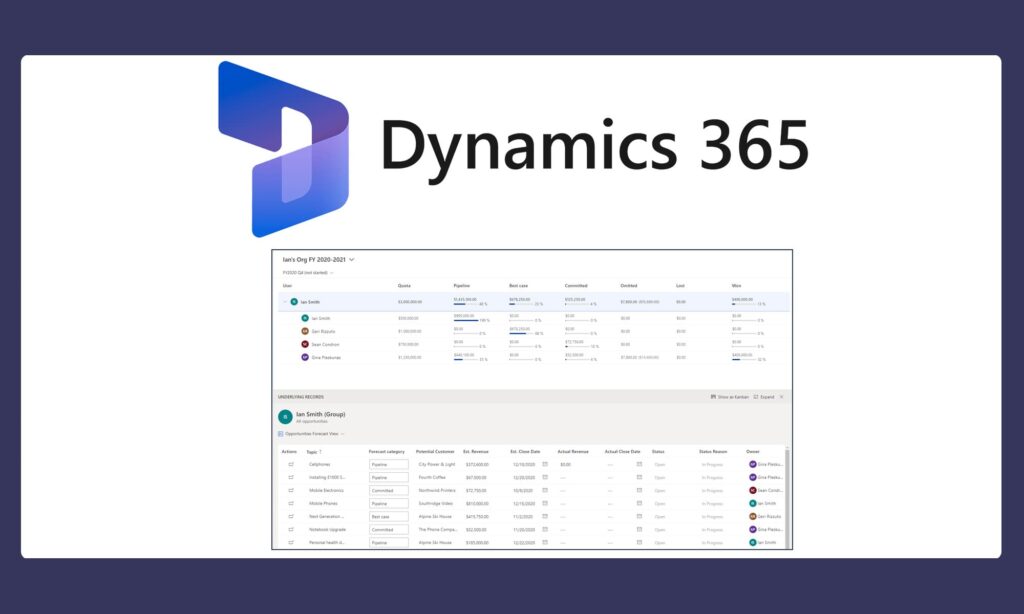
How Your Sales Team Benefits from a Dynamics 365 Sales Forecast (Part 2) Dynamics 365 for Sales offers a lot of nice features to facilitate managing your business opportunities. Over the years, SyncraTec has compiled a list of recommended customizations to the out of the box Opportunity Sales Process that add a lot of value to opportunity management. And now, Dynamics 365 for Sales has added sales forecasting to increase the probability of success for your sales team even more! It’s beneficial for a sales manager to have access to a list view of open opportunities that their team is nurturing. Dashboards and charts can improve the data visualization of these opportunities by such things as Estimated Revenue, Estimated Close Date and Probability. But, a sales forecast can help a sales team track their performance against their targets and identify risks to achieving their quotas. My previous blog highlighted how simple it is to set up and configure a sales forecast for your organization in Dynamics 365. This blog will demonstrate how sales team members and sales managers can use forecasts to achieve their sales goals. All of the functionality discussed in this blog comes FREE with Dynamics 365 for Sales, along with some additional Sales Insights functionality. Viewing and Adjusting a Forecast as a Sales Team Member A sales manager needs to have the Forecast Manager security role to configure forecasts for their organization. They can set up the type of forecast, permissions for accessing it, and the columns they want displayed on the forecast grid. After a forecast is activated, the sales team members can access the projected revenue and pipeline predictions accumulated from their opportunities. A sales team member will find forecasts in the Performance area of the navigation menu of the Sales Hub app. The drop-down list of forecasts at the top will display any forecast for which the sales team member has permissions to view. From the next drop-down list, they can choose the forecast period they want to see. These options reflect the forecast periods defined in the forecast configuration. The Forecast Grid The forecast grid displays all relevant columns as defined in the forecast configuration. The totals are aggregated by user or by territory, at each level of the hierarchy and for each period according to the forecast column attributes. The forecast illustrated in this blog was configured as an “org chart forecast”. It also uses the out-of-the-box Forecast Category option set from the Opportunity entity for column configuration (recommended by Microsoft). As a sales team member, the forecast grid summarizes opportunity values from a snapshot of the data. The upper right corner may indicate that “Fresh data is available”. Dynamics gives the user the option to update the grid with the real time values from their Opportunity records. It will include Opportunities where the user (sales team member) is the Owner and the Estimated Close Date falls within the forecast period. The default value for each column is the sum of the Estimated Revenue fields for all the Opportunities with the Forecast Category value indicated by the column name. Note: There are some changes around snapshot history in Dynamics Release 2020 Wave 2. Underlying Opportunity Records At the bottom of the forecast, you will see the underlying Opportunity records in the Opportunities Forecast View. This is the out-of-the-box default view, but it can be changed when the forecast is configured. From this Opportunities Forecast View, the sales team member can: Update the “Forecast category” column to: Pipeline – indicates with low confidence that this Opportunity will be closed as won during the forecast period (default value for new Opportunities) Best case – indicates with medium confidence that this Opportunity will be closed as won during the forecast period Committed – indicates with high confidence that this Opportunity will be closed as won during the forecast period Omitted – identifies an Opportunity that the user wants to be excluded from the estimated revenue forecast values Note: An out-of-the-box workflow automatically updates the Forecast Category to Lost or Won when an Opportunity is closed as lost or closed as won. Update additional Opportunity fields, such as Topic, Potential Customer, Est. Revenue, and Est. Close Date. Select “Show as Kanban” to display the underlying records in a Kanban type of view to easily drag Opportunity records from one Forecast Category to another. Select “Expand” to see more of their Opportunity records at one time. Navigate to the Opportunity record by clicking on the icon in the “Actions” column on the far left. The Opportunity form is opened in a new window to allow the update of any Opportunity record field while staying within the context of the forecast grid. Adjusting the Forecast The columns in the forecast grid can be configured different ways. It is up to the sales team manager to design the forecast grid to facilitate getting the most out of the forecast for their business. The forecast grid created for this blog provides the following functionality: Clicking on a Forecast Category column in the forecast grid will filter the view of underlying Opportunities accordingly. Column descriptions appear as tooltips on the column header to help the users understand what that value represents. Specific columns, like Committed in this forecast grid, have been configured to allow manual adjustments to the system-calculated values. Specific columns, like Pipeline in this forecast grid, have been configured to display a progress bar indicating the attainment percentage compared to the quota column. From the Underlying Records view, a user can modify the individual Opportunity Forecast Category directly in the view. When this occurs, the Estimated Value of the Opportunity will be subtracted out of the previous Forecast Category roll up value and added to the new Forecast Category roll up value. Adjustment Dialog Box There may circumstances where the sales team member estimates the amount that they expect an Opportunity to bring in at the close of a forecast period to be different from the roll up
How to Set Up a Dynamics 365 Sales Forecast Model (Part 1)
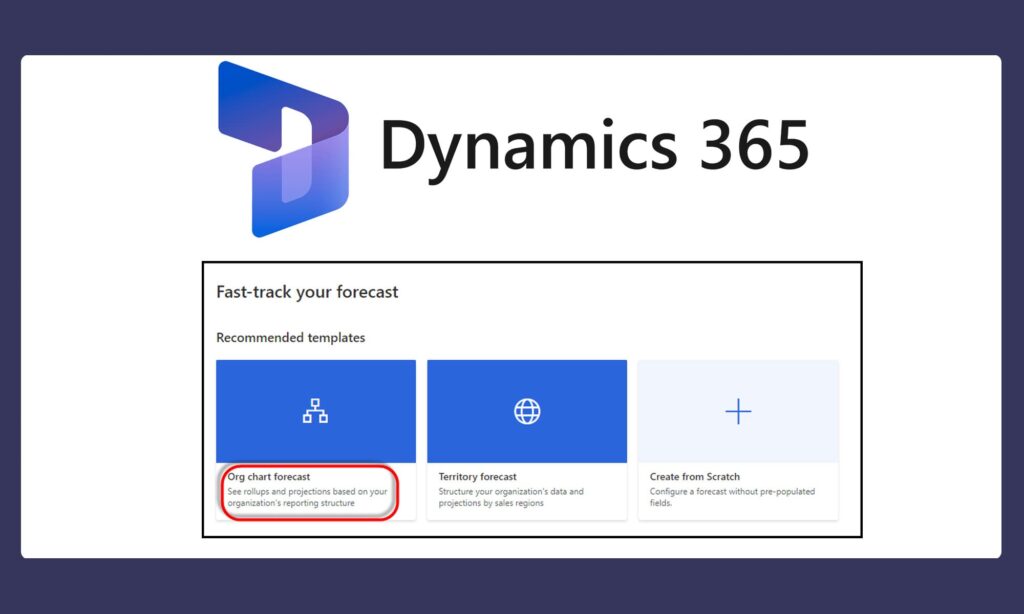
How to Set Up a Dynamics 365 Sales Forecast Model (Part 1) A sales forecast can help sellers track their performance against their targets and identify risks to achieving their goals. This blog (Part 1) is going to highlight how easy it is to set up a sales forecast for your organization in Dynamics 365. All of the functionality discussed in this blog comes FREE with Dynamics 365 Sales, along with additional Sales Insights functionality. By default, the sales forecast model is available in your organization. You need to be an administrator or have the Forecast Manager security role to configure forecasts in your organization. You can set up the type of forecast, permissions for accessing it, and the columns you want displayed on the forecast grid. After a forecast is activated, your sales team can access the projected revenue and pipeline predictions. Getting Started with Your Sales Forecast Model You can set up Dynamics 365 sales forecast models based on your organization’s reporting hierarchy, your organization’s sales regions or some other hierarchy entity. For this blog, we are going to base our forecast on our organization’s reporting structure. Note that this method assumes that Manager (User lookup) fields are already updated on User records. From the App Settings menu of the Sales Hub, select “Forecast configuration”, then choose the “Org chart forecast” template. General Properties The template is a wizard-like tool that will guide you through the configuration of your org chart forecast. Here is a list of the properties you will need to identify. Forecast name – enter a meaningful name Rollup entity – this is set to Opportunity by default and cannot be changed Hierarchy entity – this is set to User by default and cannot be changed Rollup to hierarchy relationship – defines the relationship between the rollup entity and the hierarchy entity (e.g. Owner) Top of hierarchy – for org chart forecasts, provides a drop down of Users – select the Manager – after you select the Manager, the Preview window on the right will show the hierarchy Default underlying records view – provides a drop down of Opportunity views – this is the view used when users select a row or a cell of the forecast to view its underlying Opportunities (more about this in Part 2 of this blog) Forecast period – select whether the forecast is generated monthly or quarterly Fiscal year – select the fiscal year for the forecast – this is populated based on the organization’s fiscal year settings Start this forecast – select the time period to start forecasting – Number of periods – enter the number of forecast periods to be generated – you can only create forecasts that span up to one year Valid from – read-only field – it identifies the date the forecast starts Valid to – read-only field – it identifies the date the forecast ends When you are done, click on the “Next” button. Permissions In the Permissions step of the forecast wizard, you identify which users can view and adjust the forecast data at each level. Also, you can provide access to users who have specific security roles to view the forecast. In the User security field section, the User lookup field will default to “User” for org chart forecasts. This field determines the owner of the row in the forecast grid. If you select a value other than the default, a column is created in the forecast grid. The Additional security roles section provides options to give permissions to users outside of the organization hierarchy. By default, “No additional security roles” is selected. Layout and Columns In the Layout step of the forecast wizard, you can configure columns to define the rows in the forecast grid. Every forecast needs an option set to define roll-up columns. You can add roll-up columns based on option set values that are defined for your Opportunities. Click the + Add from option set to get a list of the option sets defined on the Opportunity entity. Select an option set, and then click on Choose selected. Each option set value you select is added as a column for you to configure. Forecast Category Microsoft recommends using the out-of-the-box Forecast Category option set for column configuration. Forecast Category is an out of the box field displayed on the Opportunity form. It is used to define the confidence level of an Opportunity closing as a win. It defaults to “Pipeline”. You can add custom option set values, if you’d like. As you can see below, the Forecast Category options include Won and Lost. The Opportunity Forecast Category Mapping Process is an out-of-the-box workflow that automatically updates the forecast category when an Opportunity is set to Won or Lost. If you’re using a custom option set for column configuration, you must create a workflow to ensure that the forecast is projecting accurate values. After your columns are added, you can configure each one by clicking on the vertical ellipsis and selecting Configure. This will give you the ability to modify the column Name set the column Type (typically Rollup) define the Amount field (what you are rolling up, typically the Estimated Revenue) define the Date field (the date used to determine the forecast period, typically the Estimated Close Date) add a Description (this appears as a tooltip on the column header of the forecast grid) set Allow adjustments (to let users manually edit a system-calculated value directly in the forecast grid, indicated by a pencil icon) enable Show progress compared to quota (to compare the column’s value against the quota column indicated by a percentage shown in a progress bar) set Show in Trend Chart There is an Auto-Configuration option that would do a lot of the column configuration for you. You can always tweak it afterwards. Additional Filters By setting additional filters, you can filter the Opportunity records used to calculate the forecast values. The filters are based on attribute values that belong to the Opportunity entity, including related entity attributes. Activate &
Insider Spotlight on Common Data Service Analytics
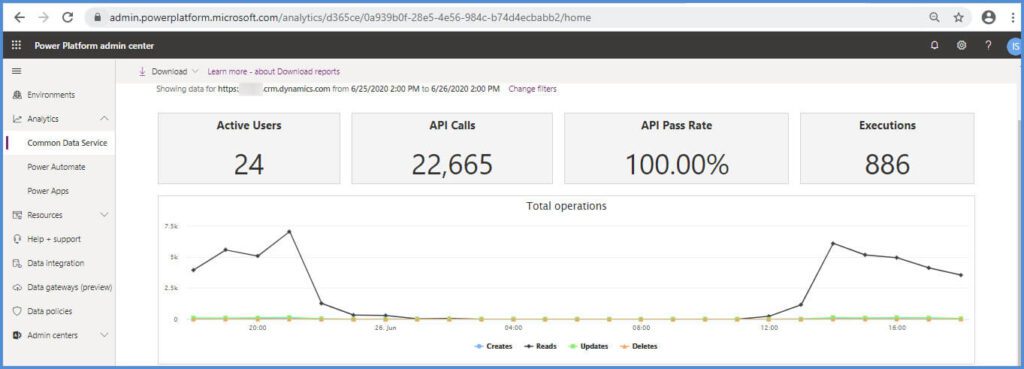
Insider Spotlight on Common Data Service Analytics The common data services analytics found in the Power Platform Administration area replaces the Organization Insights solution that needed to be installed in older versions of Dynamics 365. The Organization Insights solution has now been deprecated. Some high level information on this functionality will be outlined below. Microsoft’s detailed write up can be found here. The below is a screen shot from Microsoft’s documentation on Common Data Service analytics. Where Can I Find the Usage Analytics? Proceed to the URL https://admin.powerplatform.microsoft.com/ and login with the credentials for your organization. Below lists the security roles that users need to have to view the reports. Environment Admin – can view reports for the environments that the admin has access to. Power Platform Service admin – can view reports for all environments. Dynamics 365 Service admin – can view reports for all environments. Microsoft 365 Global admin – can view reports for all environments. Common Data Analytics – Usage Graphs and Charts When you click on Common Data Service, you will be presented with the below open to the Home tab. There are multiple tabs that contain a myriad of Graphs and Charts. Filters The filters can be expanded/decreased to look at a broader or narrower set of data. Please note: It appears at this time that the maximum range for reporting is one month. Common Data Analytics – Usage Reports In addition to the graphs and charts available in the Common data Service area, the underlying data can be downloaded. Below is a screen shot of the reports that are available. Highlight on User Statistics Available Charts If your organization is specifically interested in tracking users and their usage of the system, there are many charts and reports available to help. First, on the Home tab, you can find the below charts. The Active Users tab also contains additional charts reporting on activity as shown below. Excel Reports You can select Download as shown below to list available reports. These reports show the underlying data for some of the charts in the Common Data Analytics. If there is a filter applied for the charts, the same filter is applied to the downloaded reports. As stated above, the maximum duration for data availability is 30 days. Lets export the Most Active Users by Performing Operations report and take a look. The report is exported as a .csv file. The usernames are listed in the first column with the number of creates, updates, deletes and reads. Conclusion Organization insights has been deprecated and replaced with the Common Data Service Analytics area. There are many useful charts and underlying data reports that can be used to do analysis on the usage of your CRM system.